Cash ISA vs Stocks & Shares ISA Comparison Calculator UK
Cash ISA Total
Stocks ISA Total
Growth Cash ISA
Growth Stocks ISA
For UK savers, Individual Savings Accounts (ISAs) are one of the most powerful tools for building wealth tax-free. But with two popular choices, Cash ISAs and Stocks & Shares ISAs, the big question is: which one is right for you? A Cash ISA offers security and guaranteed interest, while a Stocks & Shares ISA provides the potential for higher long-term returns but comes with market risk. Choosing between the two can feel confusing, especially when both have unique benefits depending on your financial goals and risk tolerance.
That’s where the Cash ISA vs Stocks & Shares ISA Comparison Calculator becomes invaluable. Instead of relying on guesswork or financial jargon, this tool shows you a clear side-by-side projection of how your money could grow in each ISA type. By factoring in deposit size, monthly contributions, expected returns, and inflation, it highlights the trade-offs between safety and growth. Whether you’re a first-time saver, a parent planning for your child’s future, or an experienced investor, this calculator simplifies the decision-making process, helping you choose the right ISA for your goals with confidence.
What is a Cash ISA vs Stocks & Shares ISA Comparison Calculator?
A Cash ISA vs Stocks & Shares ISA Comparison Calculator is a specialised tool designed to help UK savers evaluate the potential growth of their money under two different ISA options. Instead of looking at generic interest rates or investment returns in isolation, it provides a direct, side-by-side view, making it easier to see which ISA aligns with your financial goals. You simply enter details like your deposit amount, monthly contributions, investment horizon, expected interest rate for a Cash ISA, and projected returns for a Stocks & Shares ISA. The Cash ISA vs Stocks Calculator then generates projections showing the value of each account over time. New to ISAs? Run the FinCalc ISA Calculator to preview allowances, tax-free growth, and access rules before you compare.
Choosing between a guaranteed interest account and a market-linked one isn’t easy. The Cash ISA vs Stocks ISA Comparison Calculator takes the guesswork out by presenting numbers in a clear, transparent format, helping you weigh stability against long-term growth. Cash ISAs provide guaranteed returns and are low-risk, ideal for short-term savings. Stocks & Shares ISAs, while riskier, have historically outperformed cash over long periods, making them suitable for long-term investors aiming for higher growth.
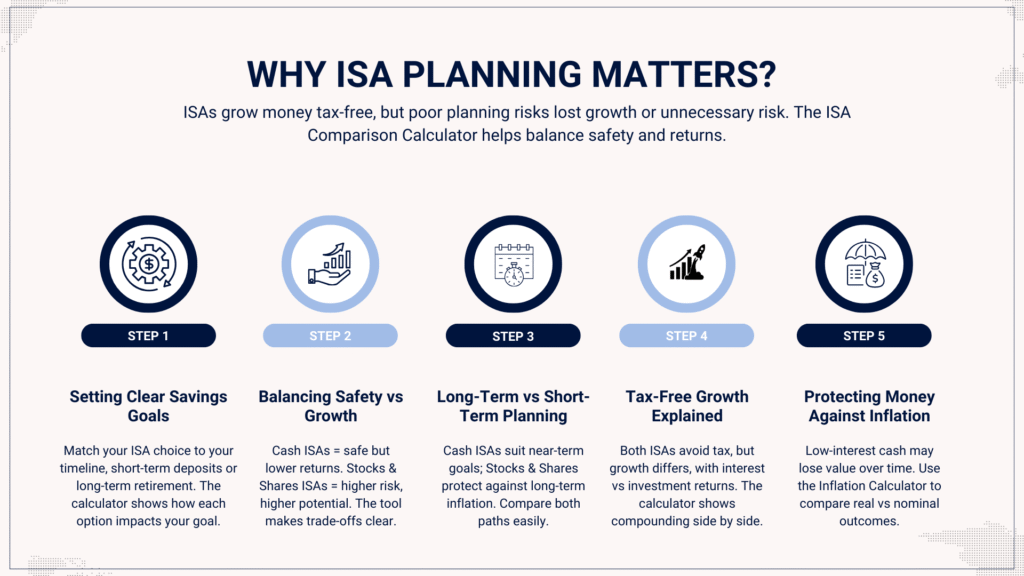
Why ISA Planning Matters?
ISAs are one of the most popular ways to grow money tax-free in the UK. But without proper planning, you could miss out on opportunities or expose yourself to unnecessary risks. The Cash ISA vs Stocks & Shares ISA Comparison Calculator helps you strike the right balance between safety and growth.
Setting Clear Savings Goals
The Cash ISA vs Stocks & Shares Comparison Calculator shows how different choices affect your goals. Whether you’re saving for a house deposit in 5 years or building wealth for retirement in 25, it ensures your ISA strategy matches your timeline.
Balancing Safety vs Growth
Cash ISAs provide certainty with fixed or variable interest rates, while Stocks & Shares ISAs carry risk but can deliver much higher returns over decades. An ISA comparison tool helps you see these trade-offs in real numbers.
Long-Term vs Short-Term Planning
For short-term savings, security matters more. For long-term goals, inflation can erode cash returns. The Cash ISA vs Stocks Comparison Calculator helps you compare both paths to see which option sustains your wealth over time.
Tax-Free Growth Explained
Both ISAs shield your money from tax, but how they grow differs. A tax-free savings estimator shows how compound interest (in Cash ISAs) stacks up against compounding investment returns (in Stocks & Shares ISAs).
Protecting Money Against Inflation
Inflation quietly reduces the purchasing power of cash. Without planning, a low-interest Cash ISA might not keep pace. Comparing ISAs side by side helps you understand whether you need growth potential to preserve value. Sense-check purchasing power using the Inflation Impact on Savings Calculator, so you can compare nominal vs real outcomes.
How the Calculator Works Step-by-Step + Example?
Cash vs market growth can feel apples-to-oranges. This workflow standardises both paths so you see clear, decision-ready numbers, side by side.
Step 1: Enter Your Deposit (Starting Balance)
Begin with your current lump sum (e.g., £5,000, £10,000). This anchors both scenarios to the same baseline, so the comparison is fair from day one.
Step 2: Add Contribution Schedule with the Cash ISA vs Stocks & Shares
Tell the tool how much you’ll add (monthly or annually). The Cash ISA vs Stocks & Shares ISA Comparison Calculator compounds these contributions in both accounts using their respective rate, so you see the cumulative outcome of disciplined saving, not just the initial deposit.
Step 3: Set Rates, Fees & Inflation
- Cash ISA: enter the interest rate (fixed/variable).
- Stocks & Shares ISA: enter an expected annual return (net of fees if you prefer).
- Fees (optional): add an annual % for S&S costs to keep projections realistic.
- Inflation (optional): toggle to view results in real terms (today’s money) as well as nominal pounds.
Benchmark rate and return assumptions with the Interest Rate Comparison Calculator to see how small % changes move the outcome.
Step 4: Choose Your Time Horizon
Pick the period you want to model (e.g., 3, 5, 10, 20 years). Short horizons often favour Cash ISAs (low risk, limited time for markets to compound). Longer horizons tend to favour Stocks & Shares (growth has time to outpace inflation).
Step 5: View Side-by-Side Results with the Cash ISA vs Stocks & Shares ISA Comparison Calculator
Get a clean comparison showing:
- Final values (nominal and inflation-adjusted)
- Total contributions vs growth (so you see what you added vs what the account added)
- Sensitivity (how results change if rates/returns move ±1–2%)
Worked Examples (Illustrative Only)
Educational scenarios to show mechanics, not predictions. Rates/returns change; capital in a Stocks & Shares ISA is at risk.
Example A, Lump Sum Only (10 Years)
- Deposit: £10,000 (no further contributions)
- Cash ISA at 3% (annual compounding)
- Stocks & Shares ISA at 6% (annual compounding)
- Inflation: 2%/year (for “real” view)
Results (approx.):
- Cash ISA nominal: £13,439; real (today’s money): ~£11,025
- Stocks & Shares ISA nominal: £17,908; real: ~£14,691
Insight: Markets beat cash over longer periods, even after inflation, but with market risk.
Example B, Monthly Saving £200 (20 Years)
- Starting balance: £0
- Contributions: £200/month
- Cash ISA at 3% (monthly compounding)
- Stocks & Shares ISA at 6% (monthly compounding)
- Inflation: 2%/year
Results (approx.):
- Cash ISA nominal: £65,660; real: ~£44,188
- Stocks & Shares ISA nominal: £92,408; real: ~£62,188
Insight: Consistency + time supercharge growth. Stocks & Shares compound faster, but you must tolerate volatility.
What’s Going On Under the Hood?
- Cash ISA: Future Value = Deposit × (1 + rate)^years + compounded contributions (annuity math).
- S&S ISA: Same structure but with an expected return (ideally net of fees).
- Real values: Nominal results ÷ (1 + inflation)^years = purchasing power in today’s pounds.
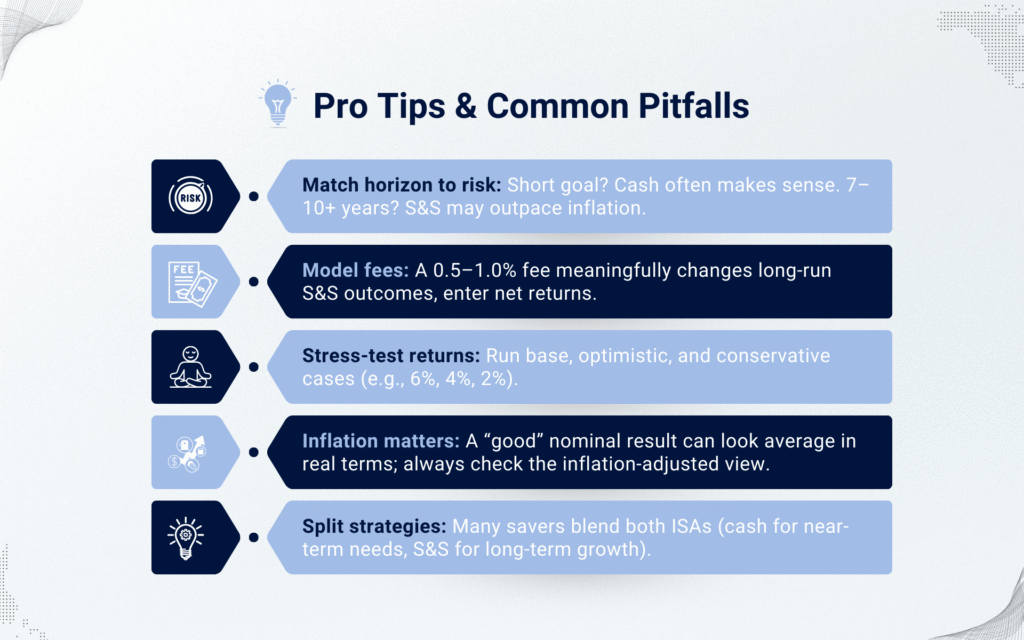
Pro Tips & Common Pitfalls
- Match horizon to risk: Short goal? Cash often makes sense. 7–10+ years? S&S may outpace inflation.
- Model fees: A 0.5–1.0% fee meaningfully changes long-run S&S outcomes, enter net returns.
- Stress-test returns: Run base, optimistic, and conservative cases (e.g., 6%, 4%, 2%).
- Inflation matters: A “good” nominal result can look average in real terms; always check the inflation-adjusted view.
- Split strategies: Many savers blend both ISAs (cash for near-term needs, S&S for long-term growth).
Benefits of Using FinCalc’s Cash ISA vs Stocks & Shares ISA Comparison Calculator
Choosing between Cash and Stocks & Shares ISAs isn’t about picking the “better” option; it’s about matching the right tool to your financial goals. The Cash ISA vs Stocks & Shares ISA Comparison Calculator helps you do exactly that, with clarity and confidence.
Transparent Side-by-Side Comparisons with the ISA Comparison Calculator
Instead of reading interest rates or investment growth in isolation, the Cash ISA vs Stocks & Shares Calculator places results next to each other. You’ll instantly see how £10,000 grows differently in a safe Cash ISA versus a riskier Stocks & Shares ISA.
Scenario Testing for Different Returns
Markets and savings rates change, but your plan shouldn’t break. With an ISA comparison tool, you can adjust returns, fees, or inflation to test multiple outcomes. This makes planning more resilient, so you’re never blindsided by reality.
Independent and Unbiased Results
Unlike bank calculators that quietly favour their own products, FinCalc’s Cash ISA vs Stocks & Shares ISA Comparison Calculator is independent. It doesn’t sell ISAs, it just runs the maths. You get honest, unbiased results every time.
Clear Visualisation of Inflation Impact
One of the biggest risks to savings is inflation. A tax-free savings estimator shows not only nominal balances but also the real purchasing power of your ISA over time. This helps you decide whether growth potential outweighs inflation erosion.
Helps You Pick the Right ISA for Your Goals
There’s no universal winner between Cash and Stocks & Shares ISAs. For short-term safety, Cash ISAs may work best; for long-term wealth, Stocks & Shares often shine. By modelling your personal numbers, this tool helps you make with confident choice.
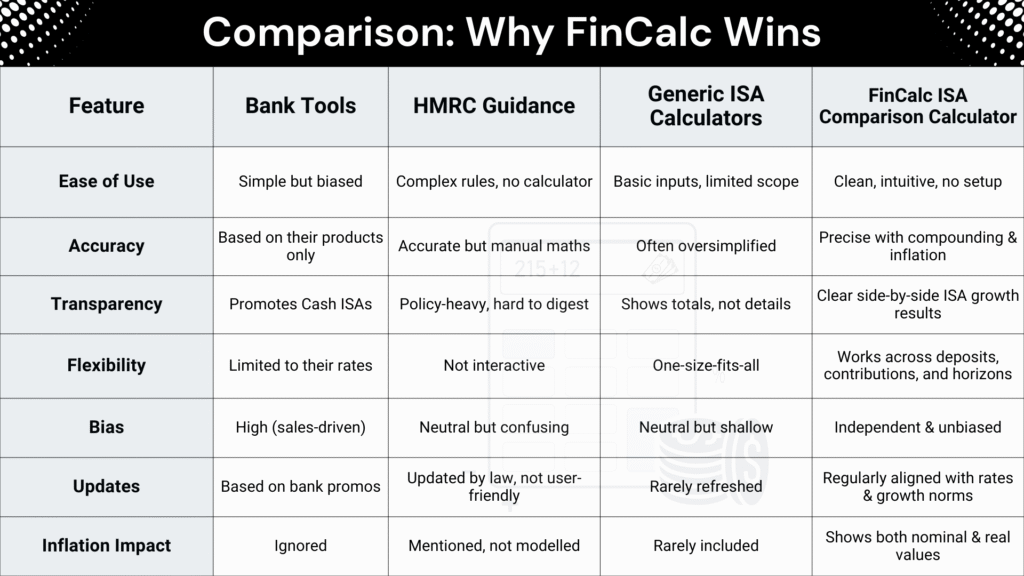
Comparison: Why FinCalc Wins
Most people either rely on bank tools, skim HMRC guidance, or try generic ISA calculators. The problem? Each option leaves big gaps; either they’re too biased, too shallow, or too complicated. FinCalc’s Cash ISA vs Stocks & Shares ISA Comparison Calculator combines simplicity with depth, giving savers the clarity they actually need.
Feature | Bank Tools | HMRC Guidance | Generic ISA Calculators | FinCalc ISA Comparison Calculator |
Ease of Use | Simple but biased | Complex rules, no calculator | Basic inputs, limited scope | Clean, intuitive, no setup |
Accuracy | Based on their products only | Accurate but manual maths | Often oversimplified | Precise with compounding & inflation |
Transparency | Promotes Cash ISAs | Policy-heavy, hard to digest | Shows totals, not details | Clear side-by-side ISA growth results |
Flexibility | Limited to their rates | Not interactive | One-size-fits-all | Works across deposits, contributions, and horizons |
Bias | High (sales-driven) | Neutral but confusing | Neutral but shallow | Independent & unbiased |
Updates | Based on bank promos | Updated by law, not user-friendly | Rarely refreshed | Regularly aligned with rates & growth norms |
Inflation Impact | Ignored | Mentioned, not modelled | Rarely included | Shows both nominal & real values |
Big savings goals can feel overwhelming when you only look at the final figure. A £20,000 wedding or a £40,000 house deposit sounds intimidating, but when broken down into smaller chunks, it suddenly becomes achievable. That’s exactly what the Savings Goal Calculator does: it translates your big target into monthly actions you can actually follow.
Breaking Down Your Goal Into Monthly Targets
Every savings plan comes down to one formula: Total Goal ÷ Time = Monthly Contribution. For example, a £12,000 car over 3 years is £333/month. If you already have £2,000 saved, that drops to £278/month. The calculator handles this math instantly, showing you both the total and the monthly breakdown.
Short-Term vs Long-Term Savings
- Short-term (under 1 year): Goals like holidays require larger monthly amounts, but they’re achievable if you’re disciplined.
- Medium-term (2–5 years): House deposits or weddings fit here. Regular monthly saving builds momentum without overwhelming your budget.
- Long-term (5+ years): Education or retirement goals require patience, smaller contributions, and often benefit from compounding.If a short-term loan is tempting to bridge a gap, sanity-check the total cost with the Payday Loan Interest Calculator first.
Worked Example 1: Holiday Fund (Short-Term)
- Goal: £3,600, Timeline: 12 months, Current: £600
- Result: £250/month required.
- Lesson: Even modest savings add up quickly when spread over time.
Worked Example 2: Wedding
- Goal: £20,000, Timeline: 24 months, Current: £2,000
- Result: ≈ £750/month.
- Lesson: Medium-term goals balance ambition with feasibility, and realistic planning avoids last-minute loans.
Worked Example 3: House Deposit
- Goal: £40,000, Timeline: 60 months, Current: £5,000
- Result: ≈ £583/month.
- Lesson: Breaking big dreams into smaller monthly goals makes them realistic and less intimidating.
Why Realistic Targets Matter
Many people either under-save (“I’ll just put away £100 a month”) and fall short, or over-save (“I’ll try £1,500 a month”) and burn out within weeks. The calculator ensures your plan is balanced, ambitious enough to reach your goal, but achievable enough to stick with consistently.
Real-Life Use Cases
The Cash ISA vs Stocks & Shares ISA Comparison Calculator isn’t just theory; it’s designed to help real people make smarter financial choices. Here are practical examples of how it works in everyday life:
Case 1: Young Saver Choosing First ISA
Emily, 22, is saving £200 a month and isn’t sure whether to play it safe or aim for growth. By using the ISA Comparison Calculator, she saw how her money might grow to £65,000 in cash vs £90,000 in stocks over 20 years. That clarity gave her the confidence to split her savings between both.
Case 2: Parent Saving for Children’s Future
James and Anna want to build a nest egg for their 10-year-old. With an ISA comparison tool, they projected that £5,000 plus £150/month could fund university costs safely in a Cash ISA, or grow even more in a Stocks & Shares ISA if they accept risk.
Case 3: Professional Balancing Risk and Return with the Cash ISA vs Stocks & Shares ISA Comparison Calculator
David, a 35-year-old consultant, is saving aggressively for a house deposit in 7 years but also wants to invest long-term. The Cash ISA vs Stocks & Shares ISA Comparison Calculator showed him that short-term funds belonged in a Cash ISA, while extra money could be invested in stocks for higher growth.
Case 4: Retiree Seeking Stability
Linda, recently retired, doesn’t want stock market volatility. A tax-free savings estimator confirmed that while a Cash ISA offers lower growth, it aligns perfectly with her priority, stability, and guaranteed income.
Case 5: Couple Splitting Savings Between ISAs
Mark and Priya wanted both safety and long-term growth. By running their numbers through an ISA comparison tool, they realised that splitting contributions, 50% to Cash ISA, 50% to Stocks & Shares ISA, gave them peace of mind and growth potential.
Understanding the Numbers
When comparing Cash ISAs and Stocks & Shares ISAs, it’s not just about interest rates or market returns; it’s about what those numbers mean for your future. The Cash ISA vs Stocks & Shares ISA Comparison Calculator helps you break down the maths into simple, actionable insights.
Interest vs Market Returns with the Cash ISA vs Stocks & Shares ISA Comparison Calculator
Cash ISAs give fixed or variable interest, typically lower but guaranteed. Stocks & Shares ISAs depend on market performance, meaning potential for higher gains but with risk. The Cash ISA vs Stocks & Shares Comparison Calculator shows side-by-side growth projections, so you understand the trade-offs clearly.
Risk Profiles Explained
A Cash ISA suits conservative savers who value security. A Stocks & Shares ISA fits those with longer horizons who can stomach ups and downs. An ISA growth estimator helps you see how risk affects returns across decades, not just years.
Inflation’s Role in ISA Choices
Inflation silently erodes the value of cash. A 3% Cash ISA return may look fine until you compare it against 2–3% inflation. The Cash ISA vs Stocks & Shares ISA Comparison Calculator highlights inflation-adjusted results, showing whether your savings are actually growing in real terms.
When Each ISA Type Makes Sense
Short-term goals like a house deposit often favour Cash ISAs for safety. Long-term goals like retirement usually lean toward Stocks & Shares ISAs for growth. A tax-free savings tool helps you decide which fits your specific timeline.
Why Choose FinCalc Over Others?
There are plenty of savings calculators online, but most are either biased towards certain providers, oversimplified, or too complex for everyday users. FinCalc’s Cash ISA vs Stocks & Shares ISA Comparison Calculator stands out because it combines clarity, independence, and accuracy in one tool.
Independent and Honest Results
Unlike bank calculators that promote their own products, the Cash ISA vs Stocks & Shares ISA Comparison Calculator is unbiased. It doesn’t try to sell you an ISA; it simply shows the numbers, helping you decide with confidence.
Transparent Side-by-Side Analysis
Many tools just show totals. FinCalc breaks it down clearly: interest earned, projected growth, and inflation-adjusted balances. This transparency helps you truly understand the trade-offs.
Flexible for Every Saver
Whether you’re saving for a short-term goal like a house deposit or long-term retirement, this ISA comparison tool adapts to different horizons, contributions, and return assumptions.
Regularly Updated with Market Rates
The Cash ISA vs Stocks & Shares ISA Comparison Calculator is regularly refreshed with realistic return assumptions, inflation settings, and ISA contribution limits, keeping your projections current.
Simple, Accessible, and Free
No spreadsheets, no complex formulas. Just enter your details and get results instantly. This tax-free savings estimator makes ISA planning easy for everyone, from first-time savers to experienced investors.
Conclusion:
Choosing between a Cash ISA and a Stocks & Shares ISA isn’t about guessing; it’s about understanding how each option aligns with your goals. A Cash ISA offers safety and guaranteed returns, while a Stocks & Shares ISA provides growth potential but with added risk. Without proper planning, savers either play it too safe and lose to inflation, or take unnecessary risks without seeing the bigger picture. That’s where the Cash ISA vs Stocks & Shares ISA Comparison Calculator comes in.
By modeling both paths side by side, it shows you exactly how your money could grow over time, both in nominal and inflation-adjusted terms. Instead of wondering whether safety or growth is better, you can see which ISA choice fits your timeline and financial priorities. Turning the winner into a monthly plan? Use the Savings Goal Calculator to translate your ISA target into an exact monthly number. Whether you’re a first-time saver, a parent planning ahead, or someone building long-term wealth, this tool brings confidence and clarity to your decision.
FAQs:
What is a Cash ISA vs Stocks & Shares ISA Comparison Calculator?
The Cash ISA vs Stocks & Shares ISA Comparison Calculator is a tool that shows how your money could grow in both ISA types, helping you decide which option suits your goals.
What’s the difference between Cash ISAs and Stocks & Shares ISAs?
Cash ISAs earn guaranteed interest with low risk. Stocks & Shares ISAs invest in markets, offering higher potential growth but with volatility and no guarantees.
Does the calculator include inflation?
Yes. The ISA comparison tool can show both nominal growth and inflation-adjusted values, so you see the real purchasing power of your savings.
Which ISA is safer?
A Cash ISA is the safer option since your capital isn’t at risk, but it may struggle to beat inflation over the long term.
Which ISA gives better long-term returns?
Historically, Stocks & Shares ISAs have outperformed Cash ISAs over 10+ years, but they come with investment risk.
Can I hold both types of ISAs?
Yes. You can split contributions between Cash and Stocks & Shares ISAs, as long as you stay within the annual ISA allowance.
How accurate is the Cash ISA vs Stocks & Shares ISA Comparison Calculator?
It provides realistic projections based on your inputs, such as deposit size, contributions, expected returns, and inflation. While markets can’t be predicted, they offer a reliable side-by-side comparison.
How much can I contribute to ISAs annually?
For the 2024/25 tax year, the allowance is £20,000, which you can put into one ISA or split across different types.